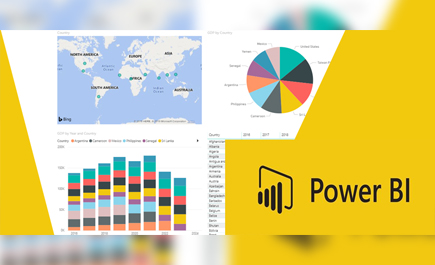
Power BI
What is Power BI?
Power BI is a Business Analytics service which aims to provide interactive Visualization & Business Intelligence Capabilities with an interface simple enough for end users to create their own Reports & Dashboards.
Microsoft Power BI is used to run reports and surface insights based on a company's data. Power BI can connect to a wide range of data sets, and "tidies up" the info it's fed so that it can be better digested and understood. The reports and visuals generated from this data can then be shared with other users.
- a data connection tool that lets you transform, combine, and enhance data from several sources
- a data modelling tool for creating data models
- a data visualization tool that generates interactive charts, graphs, maps, and other visuals.
- another visualization tool for creating immersive 3D visuals
- a question and answer engine that lets you ask questions about your data in plain language.
Components of Power BI
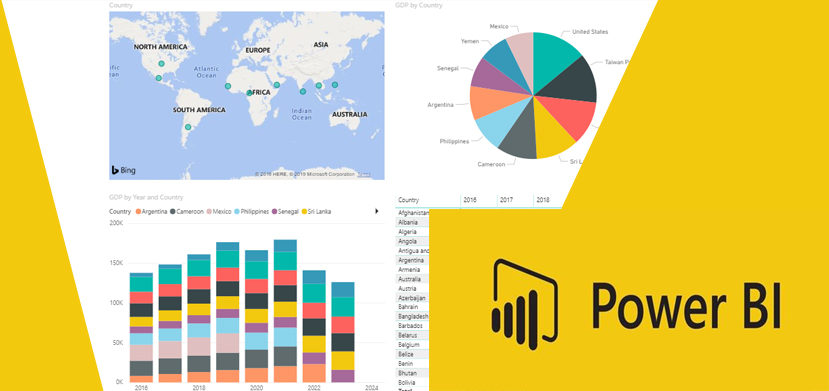
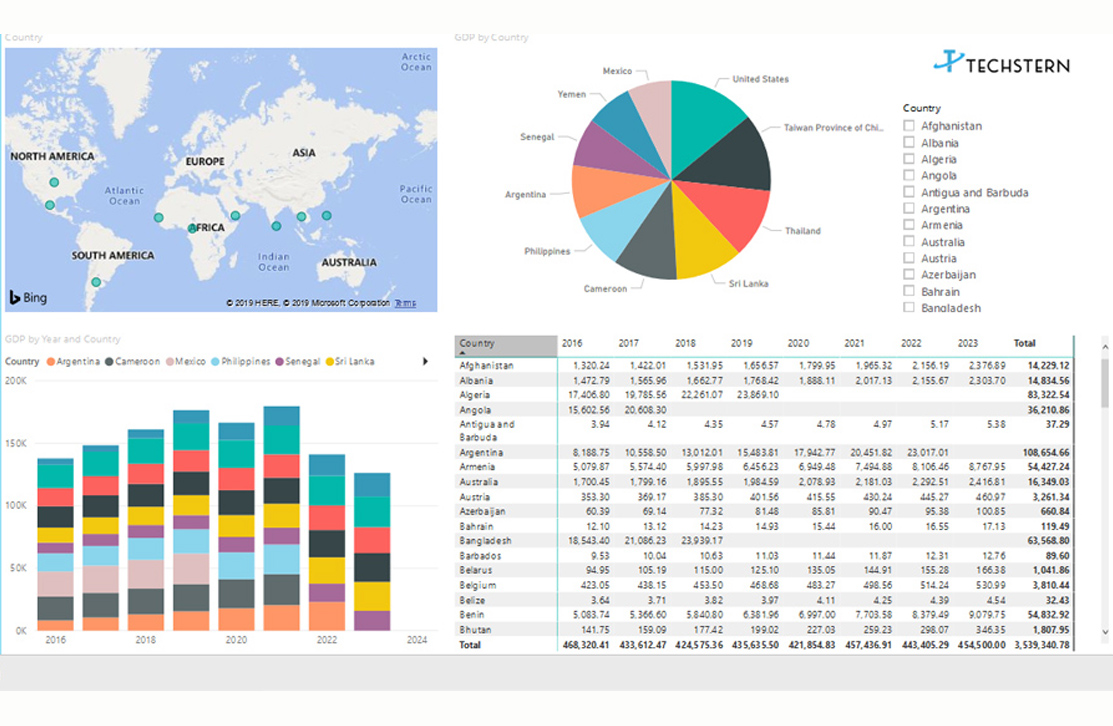
1. Visualizations: A perception is a visual portrayal of information. Techstern helps in creating an invaluable perception of the business data needed to make big Business decisions. The accompanying picture demonstrates gathering of different visualization for a client:
2. Datasets: A dataset is an accumulation of information that Power BI uses to make its representations.
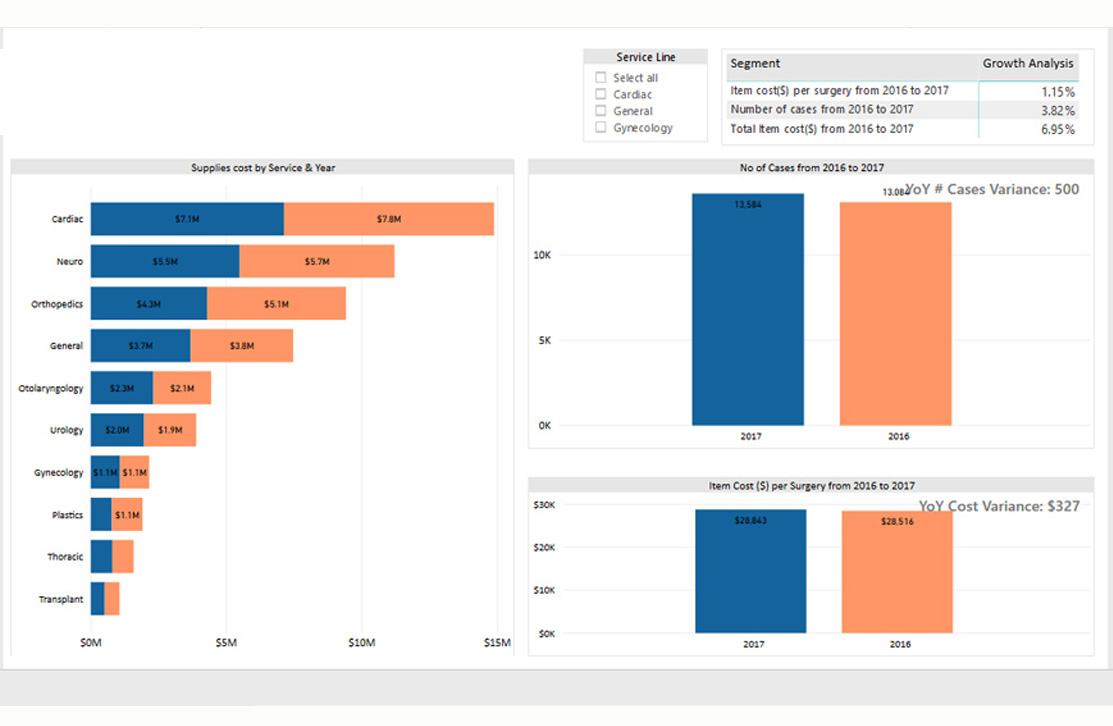
3. Reports: A Power BI report is nothing but a multi-perspective view into a data set with visualizations which represent different findings and insights from that data set. A report may be a single visualization or pages full of visualizations. Techstern helps its Clients with good insights and filters for better findings. One of the reports made by us:
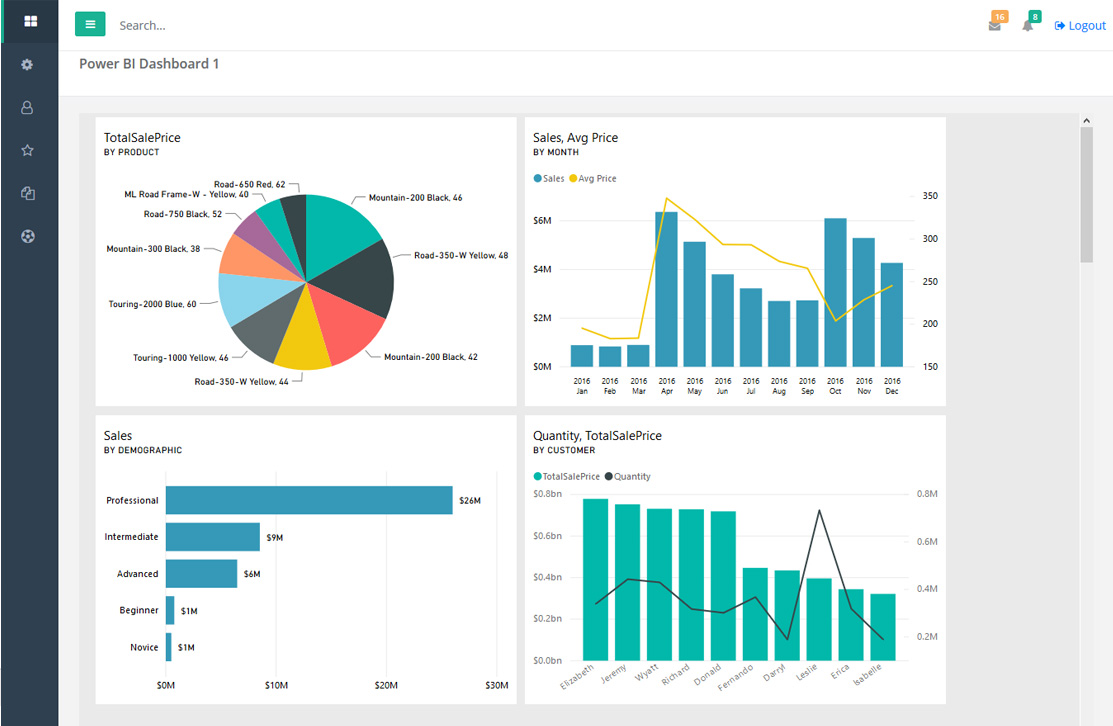
4. Dashboards: A Power BI dashboard is a single page, often called a canvas, that uses visualizations to tell a story. Because it is limited to one page, a well-designed dashboard contains only the most-important elements of that story.
5. Tiles: In Power BI, a tile is a solitary representation found in a report or on a dashboard. It’s the rectangular box that contains every individual visual.
Power BI Services
- A windows desktop application called Power BI desktop.
- An online SaaS service called the Power BI service.
- Power BI mobile apps for windows, IOS, and Android device.
- Power BI Embedded: A white-label version of Power BI which Independent Software Vendors can embed in their own apps, rather than build their own analytical features.
- Power BI Report Server: An on-premise version of the Power BI Desktop app for businesses that need to keep their data and reports on their own servers.
Advantage of Power BI over other reporting tools:
- Power BI provides a strong backend data manipulation feature with access to simple Visualization.
- Power BI has a limit of 1 GB data in free version.
- Power BI covers most of the data sources available in other reporting tools. It is closely Integrated with office 365.
- Power BI online version also supports direct visualization on search engine.
- Power BI is also a cheaper solution when compared with other reporting tools.
- Power BI uses cloud storage & includes simple implementation process.
Power BI Case Study
Challenges:
Being in Fuel Management sector, the managers and decision makers were unable to get a proper insight of both individual and company performances. Data was not trusted, meaning that any KPIs that were available did not truly drive behaviour. The business knew that accurate, available data was essential to drive their digital transformation programme.
The client was using Excel spreadsheets for the bulky data analysis and the reports generated didn’t give any analytical results. Moreover, the client was struggling with the slow processing of excel when it comes to heavy data.
The Client wanted an enterprise level reporting tool with budget constraints and better security and authentication.
The client wanted a “what if analysis”. With this, they wanted to look forward or look historically and analyze what would have happened if a different scenario had played out.
Solutions:
Considering the given situation, where there was a budget constraint but the expectations were too high, Microsoft Power BI was the only and best solution for everything they needed.
To start with, we did a POC, where we fetched the data from the database & showed them a visualization which plotted different KPIs . Then started the flow of reports through Microsoft Power BI, where we developed Day to Day Revenue Report, Customer Requirement Analysis Report, Business Transactions Report, Income Expense Report, Employee Performance Report, Return Of Investment Reports, Staffing and workload reports and many more. These reports consisted of different Visuals which included Line Charts, Pi-Charts, maps, Customer Demographics, Bar-column Graphs, Density Charts, Card Counts, Bubble Charts, every kind of visualisation possible to analyse the data.
Also, Using Microsoft Power BI dashboards and reports enabled us to create several filters which turned out to be the most influencing factor while analysing data for example filtered by date and time , filtered by demographics, filtered by type of customer etc. We integrated different Power BI APIs for security and user roles and accessibility . Client can now assign different access rights to different users enhancing data security. The database was fetched from SQL Server. We used queries/stored procedure to get data according to the client and used those in Microsoft PowerBI. By collecting rich detail and making it easy to analyze through personalized dashboards, The client now had an enterprise level Solution Microsoft Power BI for all their reports making hassle free Business decisions.
Client review:
"With Power BI, we can very quickly connect to a wide range of data sources with very little effort and use this data to run the company more smoothly than ever before. We use Power BI for everything. We love this product. Thank-you Techstern for transforming our analytics in such an amazing way!"